Mechanistic Study of Water Oxidation
This page was created to summarize Seth Croslow's REU experience at Boston College for the 2019 Summer
Note: the data on this page is intellectual property owned by Boston College
Personal Information
- Student: Seth Croslow
- Mentor: Chaochao Lang
- PI: Dr. Dunwei Wang
- College: Boston College
- Dates: June 2 - August 9, 2019
- Project Title: Mechanistic Study of Intermediates in the Water Oxidation Pathway
Additional Information
- Final Presentation: Mechanistic Study of Intermediates in the Water Oxidation Pathway
- Material and Methods: Materials and Methods Summary
Background
Water oxidation is one half reaction of a larger reaction known as water splitting. Water splitting involves the breaking and rearranging of the bonds in water to form oxygen (O2) and hydrogen (H2). Water oxidation focuses specifically on the evolution of oxygen. In order to facilitate the oxygen evolution reaction (OER), catalysts are typically used. For this project, a cobalt oxide catalyst was chosen due to its abundance in the earth's crust and because it has been heavily studied within the literature as a catalyst for water oxidation. Shown below is a proposed pathway of water oxidation on a cobalt phosphate catalyst (left) and two proposed mechanisms for the oxygen oxygen bond forming step from J. Am. Chem. Soc. 2016, 138, 4229-4236.
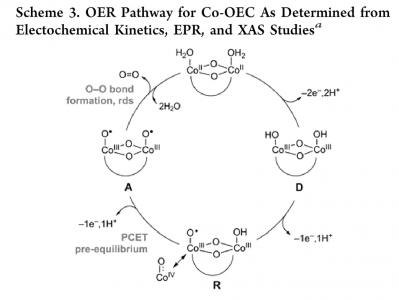
OER Pathway
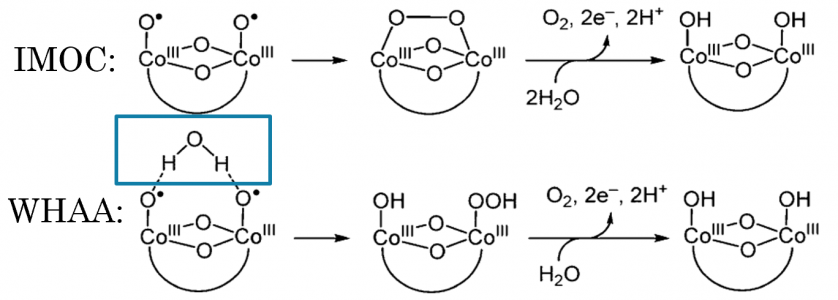
Proposed Mechanisms for Oxygen Bond Forming Step


For the two proposed mechanisms, the intramolecular oxygen coupling (IMOC) and the water hydrogen atom abstraction (WHAA), it should be noted that one key difference between the two is that the WHHA utilizes water within the mechanism. As this step is rate determining, we chose to begin the study by altering water activity to see if we can distinguish between the two mechanisms.
Electrochemistry
To begin our study, we utilized a water-in-salt method to adjust the activity of water. By adding salt into our electrolyte, the cation traps some water molecules within a solvation sheath thereby reducing the amount of water molecules available during a reaction and therefore reducing the overall activity of water. So the more salt that is added, the lower the water activity of the electrolyte solution. To estimate the overall water activity of a solution, one can calculate the mole ratio of water within the solution.
The following graph shows four water activity levels (1.00, 0.94, 0.89, 0.83) and plots them with current density on the x-axis and potential on the y-axis. The method for data collection for these trials is as follows. The catalyst was deposited onto an electrode and a CV was recorded in water activity 0. A three electrode setup was utilized including a Pt wire counter electrode, a SCE reference electrode, and the cobalt electrode as the working electrode. A linear staircase sweep voltammetry was ran which held a specific potential for 5 minutes and then increased the potential by 20 mV. The electrode was then used in the 0.94, 0.89, and 0.83 water activity solution with the same method as before. A CV was then ran again in the 1.00 water activity solution and compared to the initial CV to test the stability of the film and insure that no film degradation occurred during the trials.

Tafel Plot of Water Activity for our Cobalt Catalyst

At the lower potentials(specifically the one below 1.62 V), it is noticeable that the water activity does not change the overall current density which indicates that water is not playing a role in the mechanism. However, as the potential is increase, the current densities at each potential start to spread out with the 1.00 water activity have the largest current density and the 0.83 water activity having the lowest. This indicates that water is playing a role within the mechanism. This lead us to believe that there is a potential-dependent mechanism switch from the IMOC at low potentials to the WHAA at higher potentials. To try to validate this, we decided to use FTIR to try to look at the intermediates of the reaction and see if we can distinguish two different peaks at higher and lower potentials.
Fourier-Transform Infrared Spectroscopy
Configurations
For FTIR experiments, we began using a custom Otto Configuration that consisted of a ZnSe ATR crystal onto which we placed an FTO coated glass electrode with our cobalt catalyst face down. This, however, had large background noise and prevented evolved oxygen from escaping. We then switched to the Kretschmann Configuration which utilized a silicon ATR crystal plated with a gold film onto which our catalyst was then deposited. This configuration reduced some of the background noise and allowed oxygen to escape into the electrolyte solution.
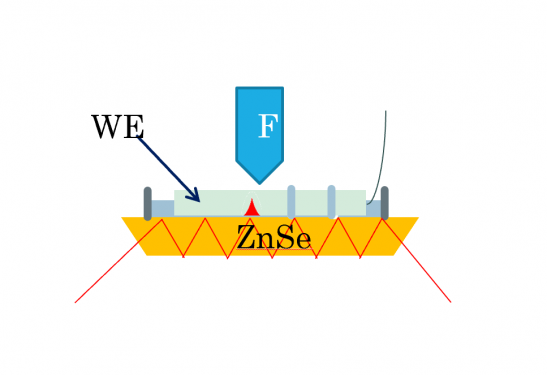
Otto Configuration

Kretchmann Configuration


Electrochemical Methods
During our FTIR data collection, we also ran various electrochemical methods to test the potential-dependance of our intermediates. One of the methods we used is shown below.

For this method, we start at a potential of 1.8 (or 1.6) which is where we notice an oxidation wave form on the CV. We hold this potential for 2.5-5 minutes to achieve a steady state. We then decrease the potential at a rate of 20 mV/s by 100 mV and hold; we follow this method until we get down to 1.0 V and then increase the potential in 200 mV increments until back up to the initial voltage. We collect FTIR data continuously throughout these trials at a rate of 1 scan every 4.611 seconds.
Isotopic Studies for Peak Detection
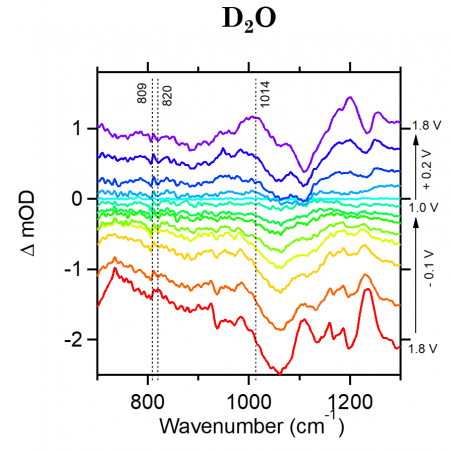
From previous literature (Nat. Chem., 2014, 6, 362-367) we know the expected frequency, or range, where our two main intermediates should be located: 1,013 cm-1 for the superoxide intermediate (Co-O-O-Co) and 740-920 cm-1 for the peroxide intermediate (Co-O-OH). The graphs shown below show FTIR data at each potential mentioned above (Electrochemical Methods Section). For these graphs, the x-axis shows the wavenumber, or frequency of IR light and the y-axis shows delta mOD, or absorbance. It should be noted that for these graph, the delta mOD is calculated by taking -1000 log(A/Ai) where A is the absorbance of each spectrum and Ai is the absorbance at the potential of 1.0V which we use as a reference.
The right side of the graph indicates the potential for each line starting at 1.8V at the bottom, cycling up to 1.0V in the middle, and increase back up to 1.8V at the top.

H2O Phosphate Buffer Electrolyte
D2O Phosphate Buffer Electrolyte
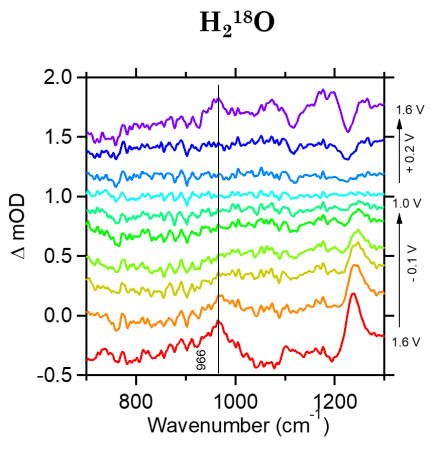
H218O Phosphate Buffer Electrolyte


In the H2O electrolyte figure (LEFT) we can see a slight peak at 1,014 cm-1 at the bottom potential 1.8V spectra. This peak then decreases in intensity as the potential decrease and then begins to increase as the potential increase. This peak shows a potential-reversibility and indicates that it may indeed be one of our transient intermediates. However, it is hard to clearly classify this as an intermediate peak due to the large interference of the phosphate band before (~987) and after the 1,014 cm-1 peak. Additional, we see another peak at 820 cm-1 that shows up at the initial 1.8V potential, however as the potential is decreases and then increased back to the starting potential(top) the peak is no longer present which indicates that this may not be a potential-dependent intermediate.
We then switched to a D2O phosphate buffered electrolyte for our FTIR experiments to see if we could see a shift in the peaks we saw in the H2O spectrum. By changing the isotope of water that we use, we can therefore change the intermediates' oxygen and hydrogen since they get replaced as the cycle completes. So if we replace the water in the solution with deuterium oxide (D2O) if the intermediate contains a hydrogen, it will be replaced and we will see a shift in the peak. We can see that the D2O electrolyte figure (MIDDLE) contains the same 1,014 cm-1 peak which indicates that the intermediate causing that peak does not include a hydrogen. The peak at 820 that we saw in the water electrolyte shows no shift either and is much less noticeable in this spectrum; it actually blends into the background noise for the spectrum, which indicates that it probably isn't an intermediate.
We then switched to a H218O phosphate buffer electrolyte (RIGHT). A noticeable shift of the 1,014 cm-1 peak to 966 cm-1 indicates the presence of an 18O-18O bond, which both of our intermediates contain.
In order to try to validate the D2O peak and remove the presence of the phosphate bands, we switched the electrolyte solution to a 0.1 M KCl solution. The following figure shows the results of that trial at high potential as well as all of the other electrolyte solutions.

You can see that the KCl trial (light blue) shows a clear, distinct peak at 1,014 cm-1 validating that we are indeed seeing a peak and not just interference from phosphate. However, the film stability was much worse in this electrolyte, shown by the CVs below. For the first CV (in potassium phosphate buffer solution) the initial(red) and final(blue) CV from the FTIR experiment are nearly identical indicating that the catalyst film did not degrade during the FTIR experiment. However, the second CV (in potassium chloride solution) has a very large oxidation wave in the forward scan of the initial CV(red). The final CV(blue) shows a large decrease in the switching potential (1.6V) current indicating large film degradation.
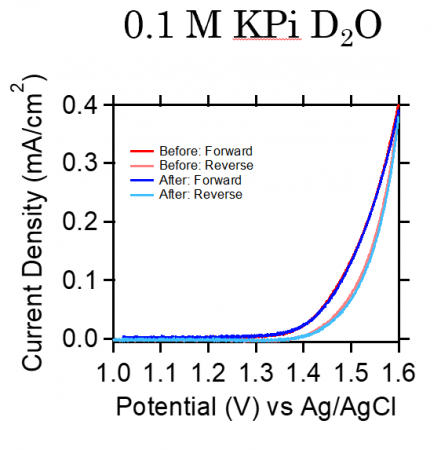
cv for KPi electrolyte

CV for KCl electrolyte


Water-in-Salt Experiment
We then wanted to see if we could recreate the electrochemical water-in-salt experiment within the FTIR, so we used a 0M (1.00 water activity) and 7M (0.83 water activity) D2O electrolyte solution for the experiment. The following two spectra are normalized to the same maximum peak absorbance in order to compare the two separate trials. In the first spectra, we can see that at the 1,014 cm-1 peak, the 1.00 water activity (blue line) has a slight shoulder with a higher absorbance compared to the 0.83 water activity (red line). This could indicate that the reduced activity is decreasing presence of the intermediate causing this peak. However, the second spectrum shows the second cycle of the FTIR at the high potential and shows almost difference between the two trials which indicate that the water isn't changing this peak. Due to these results, we are not sure if this peak is affected by the water activity or not and further studies will need to be done to make any conclusions.

Initial FTIR Scans at 1.8V
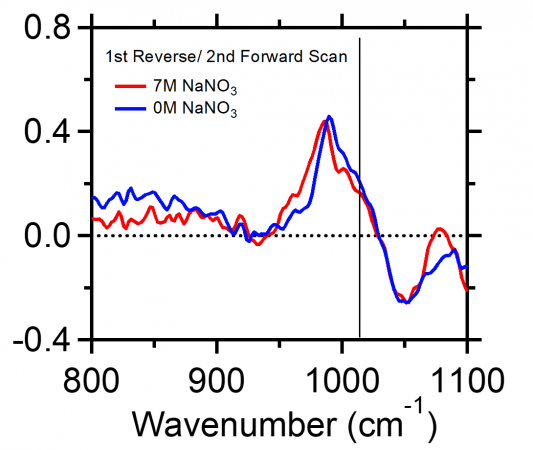
Subsequent FTIR Scans at 1.8V


Electrochemical Quartz Crystal Microbalance
As another way to try to validate the potential-dependent mechanism switch, we decided to try to use electrochemical quartz crystal microbalance (EQCM). We hypothesized that at the higher potential where the water hydrogen atom abstraction mechanism is favored (according to our hypothesis) there should be a large change in the mass of the catalyst due to adhesion of water onto the surface of the catalyst.
Background
EQCM utilizes an intrinsic property of a quartz crystal, the piezoelectric effect, to very precisely determine the mass change on the surface of the crystal. The inverse piezoelectric effect states that upon application of a potential difference to a crystal, acoustic sound waves will be produced. By changing the mass on the surface of the crystal, the fundamental frequency of the sound will change by a quantifiable amount which can allow for the extrapolation of the mass change on the surface of the crystal following the Sauerbrey equation:

The crystal we use has a fundamental frequency of 8 MHz which means that a change in frequency of 1 Hz equates to a mass change of 1.34 ng.
EQCM utilizes these properties and uses a AT-cut quartz crystal with a gold deposited film to act as a surface onto which chemical depositions can occur. This allows us to monitor the mass change of our catalyst during deposition to quantify the exact amount of catalyst deposited as well as quantify mass change at different potential. The setup for EQCM is shown below and allows us to run EQCM and electrochemical data collection simultaneously.

Initial Data
The following data was collected using our cobalt catalyst in 0.1 M potassium phosphate electrolyte solution and was collected using linear sweep voltammetry.

LSV with EQCM Data Trial 1
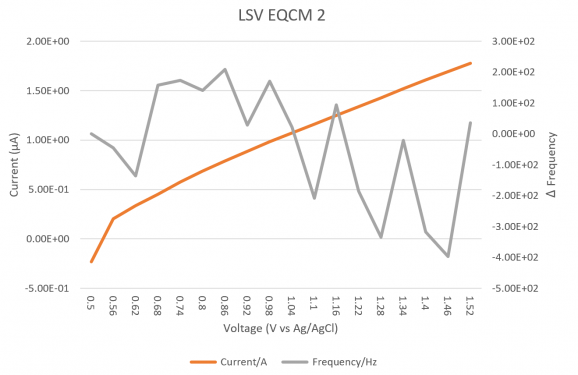
LSV with EQCM Data Trial 2

LSV with EQCM Data Trial 3


It is very noticeable how variable the EQCM data is as it is very noisy and changes frequency from negative to positive very quickly. We ended up ignoring all of this data due to the fact that the instrument was not working.
Troubleshooting
During data acquisition using the EQCM, we would nearly always get the following error:
- "The quartz crystal microbalance can not work after the cell is connected"
After playing with it and trying to fix the error, with no luck, I contacted the manufacturer, CH Instruments. They suggested that it may be a software issue and sent the newest software for the computer as well as the instrument. I flashed new software to the EQCM and update the application on the computer and we still got the same error.
The manufacturer then suggested to perform a trial in air to see if the error would still happen; no error was present. I then decided to test if maybe the reference or counter electrode were bad and replaced those and the error still arose. I then tested the setup with and without each electrode, and found out that the error only persist when the counter electrode is placed within the solution indicating that there some kind of problem when current flows between the working and counter electrodes.
With all of this in mind, we decided there was something most likely wrong with the crystal oscillator since the potentiostat worked when the EQCM option was not selected.
We then decided to ship the crystal oscillator and the cell back to the manufacturer for service.
Useful Articles
- Mechanistic Studies of the Oxygen Evolution Reaction by a Cobalt-Phosphate catalyst at neutral pH
- EPR evidence for co(IV) species produced during water oxidation at neutral pH
- Fe (Oxy)hydroxide oxygen Evolution Reaction Electrocatalysis Intrinsic Activity and the Roles of Electrical Conductivity, Substrate, and Dissolution
- On the chemical state of Co oxide electrocatalysts during alkaline water splitting
- Time-resolved observations of water oxidation intermediates on a cobalt oxide nanoparticle catalyst
- Unified structural motifs of the catalytically active state of Co(oxyhydro)oxides during the electrochemical oxygen evolution reaction