Lab Gas Laws
The in-person version of this lab has ~ 10 demo stations for which each group of student will rotate through. At each station are instructions. For this online version, in a best case scenario, each demo should be documented in your lab notebook under the demo name heading. Some demos require additional calculations. Please see the "In your notebook..." heading below indicating the information that should be recorded in your notebook (or paper).
Chapter 5 material: The content associated with these demos comes from all different sections in this chapter. Reference will be made to the section, but you will only be responsible for the specific information discussed in the demo activity.
Diffusion of Gases
- Watch this video --> https://youtu.be/Rf9j0ztzcs4
in your notebook...
- Write out the reaction that occured...
- what is the molecular mass of HCl -->
- what is the molecular mass of NH3 -->
- Eq. 5.17 indicate that the rate at which the gases "diffuse" is inversely proportional to the molecular mass. This means that because HCl is heavier than NH3, it will move slower and as a result the NH4Cl formed will not be in the center, but closer to the HCl side due to the fact that NH3 is moving faster. If you plug your molecular masses into Eq 5.17, you will see the the ratio r(NH3)/r(HCl) ~ 1.4, so the NH3 travels 1.4x the distance that HCl would have traveled.
Take home: the heavier the gas the slower it moves, the lighter the gas the faster it moves.
The Amazing bottle
- Watch this video --> https://youtu.be/pDtWRrGj6qk
This is a fun demonstration that you could do at home if you had a balloon...try it (not required)...thicker plastic bottles work the best.
in your notebook...
- Draw a detailed picture of the "amazing bottle."
Take home: If you try and blow up a balloon inside of a bottle, the pressure inside of the bottle will increase very quickly since you are decreasing the volume of the bottle very rapidly. If the pressure inside the bottle is allowed to return back to room pressure (by putting a small hole in the bottle) then it appears that you can blow it up, but this is a trick. As shown in the video, if you cover the hole after blowing up the balloon, then you will create a vacuum (low pressure) inside of the bottle preventing the balloon from deflating. You can even "such up," as opposed to "blow up" a balloon!
Cloud in a Bottle
- Watch this video --> Instant Cloud Science Experiment
This is an interesting demonstration that is really quite complex. I teach the details of this demonstration in my 300-level Physical Chemistry course; it is all about the Joule-Thomson coefficient. In short, when gases under high pressure are allowed to expand quickly to a low pressure, they can either heat up or cool down. In this demo, the gas cools down, the water vapor condenses into tiny droplets and you know this as a cloud.
in your notebook... Header with smiley face.
Take home: Weather and chemistry are connected; science is cool!
“Throwing” air
- Watch this video --> Airzooka Air Cannon
I love these "air cannons"...we have many! Steve even made the large version of one of these --> Next Level DIY Vortex Cannons!
For all of you crazies out there (you don't have to watch this one), THIS IS HOW YOU GET HURT, unless you know the chemistry (i don't have one of these)!!! --> GIANT DIY Propane Plasma Cannon!
in your notebook...
- Header with smiley face.
Take home: Like solids and liquids, gases can also be thrown, you just cannot see them.
Liquid Nitrogen
- Watch this video --> balloon in liquid nitrogen
As Charles' law tells us, if a certain volume and moles of gas changes temperature the volume will change. V1/T1 = V2/T2, where the T is in units of Kelvin!!!
in your notebook...
- If this balloon had an original volume of 2.0 L while at 298 K, what is the new volume when at 77 K (-196 oC) (the temperature of liquid nitrogen)?
- Problem with this demo...as you saw inthe video, the balloon volume essentially decreased to zero. In addition to the decrease in volume associated with a decrease in temperature, the gases inside of the balloon also condense into liquid, hence taking up nearly no volume. This is shown in this video --> {https://youtu.be/qgqT9_sEHNE Making Liquid Air and Extracting Oxygen Nitrogen and Carbon Dioxide]
LOTS of other videos if you wish...
- - 25,000 Ping Pong Ball Explosion - DIY Sci S02:E01
- - Australian TV Host almost killed by Exploding Coke Bottle
Take home: Liquid nitrogen is very fun to play with, but it is so cold that you can freeze your fingers almost immediately. Additionally, if you seal it in a container, the pressure will increase to the point that ANY container will become compromised, ie. "explode."
Boyle’s Law (Sec 5.3)
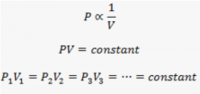
- Watch this video --> Boyle's Law Lab

in your notebook...
- The following set of data was collected during the video/experiment where the syringe volume was changed and the pressure was recorded.

- - Enter this data into a similar table in your notebook.
- - Install Microsoft Office suite of software on your computer...if not already done...see here.
- - Enter this data into an Excel and graph, 1/V vs. P <--this will give you a straight line...if it is curved, then you plotted V, not 1/V.
- "insert" scatter plot, points only, add trendline with equation, label axes, and add your name as a text box.
- - SEND A SCREENSHOT of this graph to me via email.

Take home: This experiment confirms the inverse relationship between pressure and volume."
Charles’ Law (Sec 5.3)
- Watch this video --> Charles Law Lab
I redid this experiment and collected the following set of data:

in your notebook...
- - Enter the above data into your notebook,
- - Make the following graph in Excel,
- you will need to "select data" (as i have taught you in lab) to add all of the data sets to the graph; for some reason Excel was not behaving properly with only 2 data points...use "select data."
- In order to make the trendline extend backwards, use 'Forecast: Backwards: 300 units
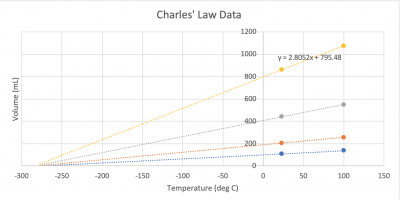

- - You will notice that i showed the trendline equation for 1 data set --> y = 2.8052x +795.48. Since the y = volume and x = temperature, what value might you expect to get if we were able to cool the flask down so that there was zero volume? volume = 2.8052 * temperature +795.48, or at volume = 0; 0 = 2.8052 * temperature +795.48 --> solving for temperature = -284 oC ~ -273 oC = 0 K <-- "absolute zero".
- - SEND A SCREENSHOT of this graph to me via email.
Take home: Temperature and volume are directly proportional. This experiment also confirmed/predicted the value for absolute zero, the theoretically lowest temperature that can be reached."