Difference between revisions of "HPA Project"
| (35 intermediate revisions by the same user not shown) | |||
| Line 4: | Line 4: | ||
My research partner, Will Fox, ran a similar experiment with acetaminophen, the link to his page can be found [[Acetaminophen_Project|here.]] | My research partner, Will Fox, ran a similar experiment with acetaminophen, the link to his page can be found [[Acetaminophen_Project|here.]] | ||
| + | |||
| + | ==HPA General Information== | ||
| + | |||
| + | IUPAC name: 2-(4-Hydroxyphenyl)acetic acid | ||
| + | |||
| + | HPA is a model substrate for oxidative processes. It is also involved in the metabolic processes of some plants. HPA was chosen for this experiment because it is biologically active, has a phenol group that is easily oxidized, and the peroxidase doesn't contribute to the effects of this chemical. | ||
| + | |||
| + | '''Physical Properties of HPA''' | ||
| + | |||
| + | [[File:chemsketch_HPA.jpg|200px]] | ||
| + | |||
| + | Molecular weight: 152.149 | ||
| + | |||
| + | Melting point: 150°C | ||
| + | |||
| + | Boiling point: 346.6°C | ||
| + | |||
| + | Density: 1.3 g/mL | ||
| + | |||
| + | pKa (predicted): 4.5 | ||
| + | |||
| + | Described as a beige powder. | ||
==Making the Samples== | ==Making the Samples== | ||
| Line 47: | Line 69: | ||
'''Equation''' | '''Equation''' | ||
| − | The following equation was used to find the concentration of | + | The following equation was used to find the concentration of HPA in our samples. The equation is solved for x, which is concentration, then the absorbance is plugged in for y and solved. |
y = 0.0486x + 0.0021 | y = 0.0486x + 0.0021 | ||
| Line 100: | Line 122: | ||
| + | ==IGOR Data Files== | ||
| + | |||
| + | This is the IGOR file for the simulation of the Gepasi Data. | ||
| + | |||
| + | [[:File:gepasi_sim.pxp]] | ||
| + | |||
| + | This is the IGOR file for the graph of the Gepasi data which gave us absorbances. | ||
| + | |||
| + | [[:File:geprates.pxp]] | ||
| + | This is the IGOR file for the graph of the differing concentrations of hydrogen peroxide in the HPA/HRP reaction. | ||
| + | [[:File:allsamplesupdated.pxp]] | ||
==Gepasi== | ==Gepasi== | ||
| Line 108: | Line 141: | ||
[[Gepasi|Gepasi]] | [[Gepasi|Gepasi]] | ||
| + | |||
| + | We used several different HRP reactions to collect data from Gepasi. These reactions can be found [[Gepasi_HRP_Reactions|here.]] | ||
'''Gepasi Graphs''' | '''Gepasi Graphs''' | ||
| Line 119: | Line 154: | ||
File:ahradical_dimer_rates_graph.jpg|Figure 7. Graph of the different AH radical concentrations when the rate of the dimerization was increased. This graph has the conditions of HRP 2 rate at 1e4. | File:ahradical_dimer_rates_graph.jpg|Figure 7. Graph of the different AH radical concentrations when the rate of the dimerization was increased. This graph has the conditions of HRP 2 rate at 1e4. | ||
File:1e5_AH_Radical.jpg| Figure 8. Graph of the different AH radical concentrations when the rate of the dimerization was increased. This graph has the conditions of HRP 2 rate at 1e5. | File:1e5_AH_Radical.jpg| Figure 8. Graph of the different AH radical concentrations when the rate of the dimerization was increased. This graph has the conditions of HRP 2 rate at 1e5. | ||
| + | File:newratesgep.jpg| Figure 9. Graph of the oxidation products with differing rates. | ||
| + | File:brad_new_gepgraph.jpg| Figure 10. Simulation of the oxdation product data from Gepasi. | ||
</gallery> | </gallery> | ||
| + | |||
| + | ==Copasi== | ||
| + | |||
| + | We used the software Copasi to analyze the kinetics of the reaction between horseradish peroxidase (HRP) and hydrogen peroxide. Copasi simulates how the compounds will react with each other. The following link describes how to run Copasi: | ||
| + | |||
| + | [[Copasi|Copasi]] | ||
| + | |||
==Data Summary== | ==Data Summary== | ||
From Gepasi we learned that the enzyme is recycled much more quickly when the rate of the HRP 2 is increased. This means only a small amount of the enzyme is required when the rate of the HRP 2 is higher. | From Gepasi we learned that the enzyme is recycled much more quickly when the rate of the HRP 2 is increased. This means only a small amount of the enzyme is required when the rate of the HRP 2 is higher. | ||
| + | |||
| + | ==ChemSketch== | ||
| + | |||
| + | <gallery> | ||
| + | File:chemsketch_HPA.jpg|Figure 11. The chemical structure of HPA. | ||
| + | File:chemsketch_HPA_aa.jpg|Figure 12. The chemical structure of one of the oxidation products "AA." | ||
| + | File:chemsketch_HPA_bb.jpg|Figure 13. The chemical structure of one of the oxidation products "BB." | ||
| + | File:chemsketch_HPA_ab.jpg|Figure 14. The chemical structure of one of the oxidation products "AB." | ||
| + | File:chemsketch_HPA_radicals_2.jpg|Figure 15. The chemical process of the radical resonance. | ||
| + | File:chemsketch_HPA_tri.jpg|Figure 16. The chemical structure of one of the oxidation products "triAH2." | ||
| + | File:chemsketch_HPA_triiso2.jpg| Figure 17. The chemical structure of one of the oxidation products "triisoAH2." | ||
| + | </gallery> | ||
==References== | ==References== | ||
Latest revision as of 21:30, 30 June 2020
Project Overview
For this project, the goal was to quantify the concentration of HPA remaining in solution after a reaction between hydrogen peroxide, horseradish peroxidase, and HPA is completed. To do this we made standards of known concentrations of HPA, made reaction vials of the hydrogen peroxide, enzyme (horseradish peroxidase), and HPA. We ran these through the HPLC to collect the data.
My research partner, Will Fox, ran a similar experiment with acetaminophen, the link to his page can be found here.
HPA General Information
IUPAC name: 2-(4-Hydroxyphenyl)acetic acid
HPA is a model substrate for oxidative processes. It is also involved in the metabolic processes of some plants. HPA was chosen for this experiment because it is biologically active, has a phenol group that is easily oxidized, and the peroxidase doesn't contribute to the effects of this chemical.
Physical Properties of HPA

Molecular weight: 152.149
Melting point: 150°C
Boiling point: 346.6°C
Density: 1.3 g/mL
pKa (predicted): 4.5
Described as a beige powder.
Making the Samples
This project required HPA standards to be made. The following link describes this process.
Our actual samples to be tested required the making of a 2 mM HPA pH 5 buffer stock solution, a hydrogen peroxide stock solution, and a horseradish peroxidase solution.
2 mM HPA Buffer Stock Solution
Put the 2 mM HPA standard into a bottle and add a pH 5 buffer tablet. Stir until dissolved.
Hydrogen Peroxide Stock Solution
Measure 5 mL of water into a scintillation vial. Add 283 microliters of 30% hydrogen peroxide to the water. This provides a hydrogen peroxide solution of about 0.413 M.
Horseradish Peroxidase Stock Solution
Preparing the Final Samples
Measure out 5 mL of the 2 mM HPA buffer stock solution into 4 different scintillation vials. Add hydrogen peroxide solution in different amounts to each vial (3 microliters, 6 microliters, 12 microliters, and 24 microliters). Add 10 microliters of horseradish peroxidase solution to each vial.
Instrumentation
After making the standards, we tested the standards using the HPLC to see where the peaks were for the different concentrations of HPA.
The following link goes into more depth about working with the HPLC:
What the HPLC Tells Us
We ran these samples through the HPLC at the wavelength of 275 nm, which is the lambda max for HPA. Running the samples at this wavelength tells us how much the samples absorb at this wavelength.
Data Analysis
To analyze the HPLC data, the data was exported as an arw file. This file was then loaded into Igor, which we used to make chromatograms. Chromatograms allowed us to gain a better understanding of the how each concentration of HPA absorbs at 275 nm for our standards, and how each sample absorbs at 275 nm. We used the information from the chromatograms to make standard curves in excel. The slopes of the standard curves gave us an equation we could use to find the concentration of a sample using the absorbance.
Example standard curve data can be found here.
Equation
The following equation was used to find the concentration of HPA in our samples. The equation is solved for x, which is concentration, then the absorbance is plugged in for y and solved.
y = 0.0486x + 0.0021
R² = 1
Chromatogram Data

IGOR Data Files
This is the IGOR file for the simulation of the Gepasi Data.
This is the IGOR file for the graph of the Gepasi data which gave us absorbances.
This is the IGOR file for the graph of the differing concentrations of hydrogen peroxide in the HPA/HRP reaction.
Gepasi
We used the software Gepasi to analyze the kinetics of the reaction between horseradish peroxidase (HRP) and hydrogen peroxide. Gepasi simulates how the compounds will react with each other. The following link describes how to run Gepasi:
We used several different HRP reactions to collect data from Gepasi. These reactions can be found here.
Gepasi Graphs
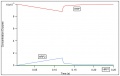
Figure 2. Graph of the different HRP phases during the reaction.

Figure 3. Graph of the different HRP concentrations when the rate of the HRP2 was increased.

Figure 4. Graph of the different HRP 1 concentrations when the rate of the HRP2 was increased.
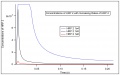
Figure 5. Graph of the different HRP 2 concentrations when the rate of the HRP2 was increased.

Figure 6. Graph of the different AH radical concentrations when the rate of the HRP2 was increased.

Figure 7. Graph of the different AH radical concentrations when the rate of the dimerization was increased. This graph has the conditions of HRP 2 rate at 1e4.
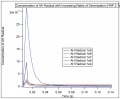
Figure 8. Graph of the different AH radical concentrations when the rate of the dimerization was increased. This graph has the conditions of HRP 2 rate at 1e5.
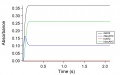
Figure 9. Graph of the oxidation products with differing rates.
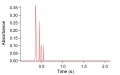
Figure 10. Simulation of the oxdation product data from Gepasi.


Copasi
We used the software Copasi to analyze the kinetics of the reaction between horseradish peroxidase (HRP) and hydrogen peroxide. Copasi simulates how the compounds will react with each other. The following link describes how to run Copasi:
Data Summary
From Gepasi we learned that the enzyme is recycled much more quickly when the rate of the HRP 2 is increased. This means only a small amount of the enzyme is required when the rate of the HRP 2 is higher.
ChemSketch
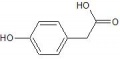
Figure 11. The chemical structure of HPA.
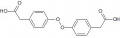
Figure 12. The chemical structure of one of the oxidation products "AA."
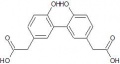
Figure 13. The chemical structure of one of the oxidation products "BB."
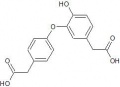
Figure 14. The chemical structure of one of the oxidation products "AB."
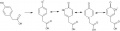
Figure 15. The chemical process of the radical resonance.

Figure 16. The chemical structure of one of the oxidation products "triAH2."
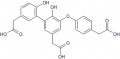
Figure 17. The chemical structure of one of the oxidation products "triisoAH2."


